

Next: Simple Deadlock with Slicing
Up: Guided Tour
Previous: Windows
Deadlock.java
displays the code for a simple
multi-threaded Java program. The program's execution
in the main method of class Deadlock
proceeds as follows. Two Lock objects are created, and then
thread objects of type Process1 and Process2 are created.
Finally, the threads corresponding to Process1 and Process2
are started (this initiates the execution of the run method
in Process1 and Process2).
The run methods of Process1 and Process2 have a
similar structure. Each run method first increments a variable
called state that has been included to illustrate slicing and
abstraction. Next, run of Process1 tries to acquire the
lock of lock1 and then the lock of lock2, while
Process2 tries to acquire the lock of lock2 and then the
lock of lock1. There are some schedules for these threads that
do not result in a deadlock - for example, if Process1
successfully acquires both locks then releases them at the end of the
synchonized block, and then Process2 is free to acquire
both locks. However, there are schedules which lead to a deadlock -
for example, if Process1 acquires lock1 and then before
it can acquire lock2, Process2 acquires lock2.
We'll now use Bandera (with the Spin model-checker) to detect a
deadlocking schedule.
- First, choose the Open option from the
Session menu (or click the Open icon in the top
tool-bar). This will bring up a file dialogue window. If you were in
the appropriate directory when you started Bandera, you should see a file
called
tutorial-examples.session
in the file dialogue window.
Left-click on the file
tutorial-examples.session. - Now
left-clicking the Open button in the file dialogue window
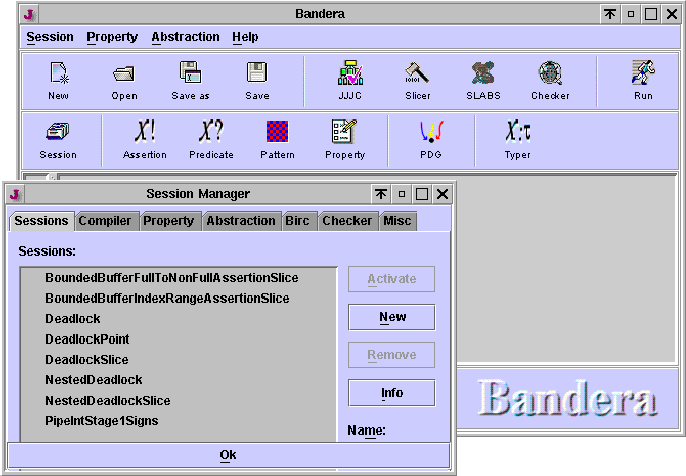
will bring up the Session Manager window. You should now have two
windows on your screen as shown in Figure 4.

Figure 4: Main Frame and Session Manager Window
- Select the session named
Deadlock. This now gives the options
of activating the session (making it the current session of Bandera),
removing the session (deleting it from the session file), or bringing
up information summarizing the settings of the session. - Choose the Activate option. You can now see that the
JJJC and Checker options are enabled in the top tool-bar (they
changed from grey to color and they have a check-mark over the icon). You can
also click the tabs (Compiler, Property, Abstraction,
etc.) in the Session Manager window to see the various settings for the session.
For example, under the Checker tab, note that Spin has been chosen as
the back-end model-checker. If you wish, you can also control Spin's
command-line options by clicking on the Options button beside of the
check-box for Spin. Note the Resource Bounded option at the right
bottom part of the Spin Option window. When checked, the
Resource Bounded option will put bounds on the range of the resources
specified by Birc constants under the Birc tab of the Session Manager.
If your program violates the bounds set by Birc constants, the violation will be
ignored and the model check will be performed on the model with the bounded
resources. If you want to be notified of the resource bounds violation, uncheck
the Resource Bounded option in the Spin Option window.
It is important to note that if no temporal property or assertion
has been specified, Bandera will automatically check for deadlock.
- Close the Session Manager window by clicking the OK bar at
the bottom of the window. If you would press the tool-bar Run
option now in the main window, Bandera would parse the
Deadlock.java file, generate output for Spin, and invoke Spin
to check the generated model. Before we do this however, we want to
demonstrate the code browsing facilities of Bandera. Therefore,
disable the checking engine by clicking on the Checker
option in the top tool-bar of the main window (the Checker button
should now turn grey). -
Now click
the Run option to have Bandera load and parse the
Deadlock.java code.
Now take some time to browse the code following the instructions
given in the preceding section.
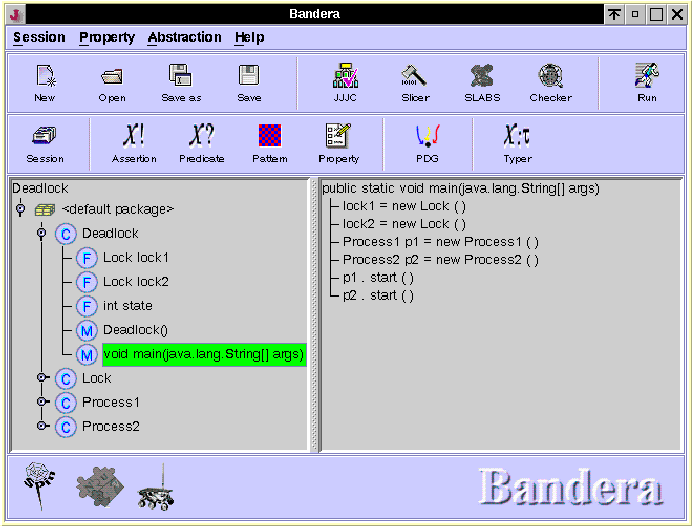
For example, if you click on the default package node, then the switch
for the Deadlock class, and then the main method,
your main Bandera window should look like the window of
Figure 5.

Figure 5: Code Browse
Now let's run a model-check. Click on the Checker tool-bar
button to enable the selected checker, then press the Run
button. Bandera will now crunch a way for a while. If you want
to see (to some extent) what is happening behind the scenes, watch
the contents of the terminal window that you used to invoke Bandera.
After Spin is finished checking the generated model, for this example
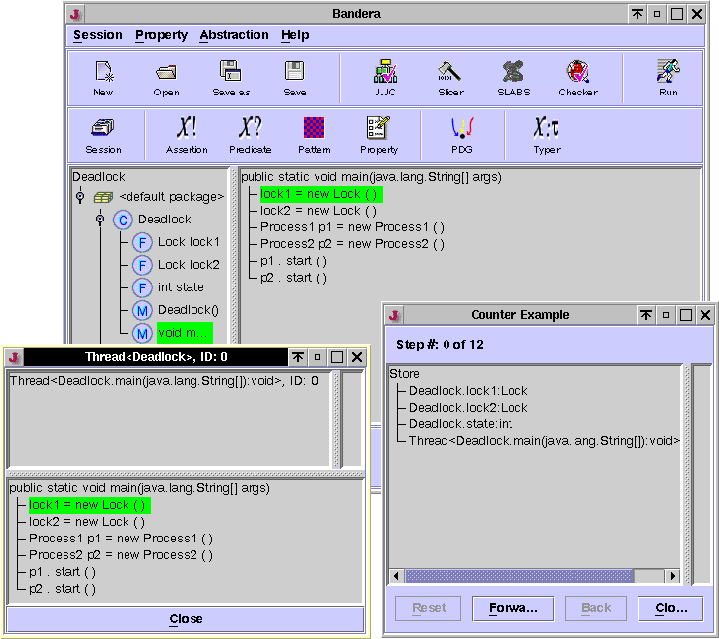
Bandera will determine that an error-trace has been found. Two new
windows should pop up on the screen as shown in
Figure 6 (you may need to
reposition the new windows to get them to appear as in
Figure 6).

Figure 6: Error Trace
The window on the bottom right is the Counter-example
Control window. At the bottom of this window are buttons that are used
to navigate along the path of the counter-example (error trace).
Forward steps one step forward in the error trace,
Backward steps one step backward in the error trace,
Reset goes to the beginning of the error trace.
During error trace display, Bandera creates a new code display window
for each thread when the thread's run method is originally called.
This allows the user to monitor the current position of the program counter
within each thread. Sometimes, there are so many threads in the program
that the screen becomes cluttered. In this case, you can ``iconize''
some of the of the thread windows. Clicking on the Close button in
the Counter-example Control window closes all the windows associated with
counter-example display (the control window is closed along with the
code window for each thread).
- Now step forward along the trace by pressing the Forward
button in the Counter-example Control window twice. As you do this, a
green bar will highlight the current position of the program counter
in the main Bandera code display window and also in the code display
window for each thread. The program counter bar sits on the next
statement to be executed (i.e., the colored statement has not been
executed yet). Bandera allows you to examine the contents
of the (abstracted) store (including heap values) by clicking on variables
listed in the Store section of the Counter-example Control window.
In particular, clicking on a variable of Object type allows you to
see the thread that is holding the object's lock and the threads
that are waiting on the object's lock. Click on some of the variables
to see their values. At this point in the trace, the lock objects
show no threads waiting or holding the lock, and the
state
variable has a value of 0. - Now step forward along the trace by pressing the Forward
button in the Counter-example Control window until the program counter
bar is at
p1.start(). With the next push of the
Forward button, Bandera will pop up the window for the
Process1 thread. Now the program counter bar sits at
the first line in the Process1 thread. - Move forward two more steps until the program counter
bar is at
synchronized (Deadlock.lock2). By this point,
the Process1 thread has acquired lock1. You can
see this by clicking on lock1 in the store pane of the
Counter-example Control window. You can also see that the value
of the state variable has been incremented (it was 0 before,
now it should be 1). - Move forward until the display indicates step 9 of 12,
and the code display window for the
Process2 thread pops
up. Move forward two more steps. The program counter
bar in the window for Process2 should be at the line
synchronized (Deadlock.lock1). Clicking on lock2 in
the store pane shows that Process2 holds the lock for lock2. - Moving forward one more step reaches the deadlock state.
Process2
tries to execute the statement synchronized (Deadlock.lock1)
but cannot complete it because Process1 holds the lock. - Now, you can move backward along the counterexample if you wish.
When you have finished experimenting with the display, press the
Close button in the Counter-example Control window.


Next: Simple Deadlock with Slicing
Up: Guided Tour
Previous: Windows
Roby Joehanes
Wed Mar 7 18:30:51 CST 2001
